React Chrome Developer Tools
This blog site has been archived. Go to react.dev/blog to see the recent posts.
With the new year, we thought you’d enjoy some new tools for debugging React code. Today we’re releasing the React Developer Tools, an extension to the Chrome Developer Tools. Download them from the Chrome Web Store.
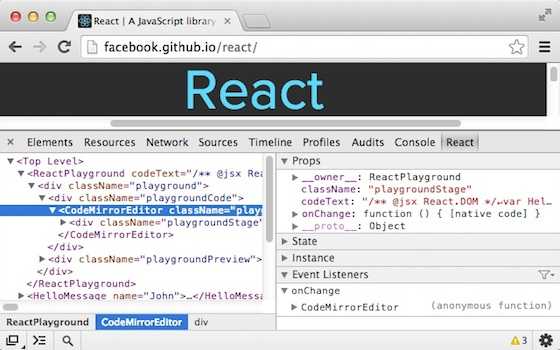
You will get a new tab titled “React” in your Chrome DevTools. This tab shows you a list of the root React Components that are rendered on the page as well as the subcomponents that each root renders.
Selecting a Component in this tab allows you to view and edit its props and state in the panel on the right. In the breadcrumbs at the bottom, you can inspect the selected Component, the Component that created it, the Component that created that one, and so on.
When you inspect a DOM element using the regular Elements tab, you can switch over to the React tab and the corresponding Component will be automatically selected. The Component will also be automatically selected if you have a breakpoint within its render phase. This allows you to step through the render tree and see how one Component affects another one.
We hope these tools will help your team better understand your component hierarchy and track down bugs. We’re very excited about this initial launch and appreciate any feedback you may have. As always, we also accept pull requests on GitHub.